Oona Schmid
Oona Schmid is chief of staff at Operation Renewed Hope Foundation, Inc., in Alexandria, Virginia.

Infographics are a user-friendly way to present data, but for small associations with budget constraints, finding the resources and bandwidth to build graphics can be a challenge. By using free services and following simple steps, even the smallest groups can master data visualization.
Infographics can simplify complicated stories, making the impact of your association or nonprofit highly legible at a single glance. Because 90 percent of the information transmitted to the brain is visual, pictures can help to expedite comprehension. Plenty of crackerjack designers can create a compelling infographic, but what if you work at a small association with an equally small budget?
In the interest of helping small-staff associations, I turned to the vast world of do-it-yourself infographics. At my organization, Operation Renewed Hope Foundation, which helps to end veteran homelessness, our data serves mostly internal uses, so external audiences can often find it hard to digest. An infographic can be the solution. The following three steps explain how I created an infographic displaying data that we collected on veteran housing and assistance.
Our data serves mostly internal uses, so external audiences can often find it hard to digest. An infographic can be the solution.
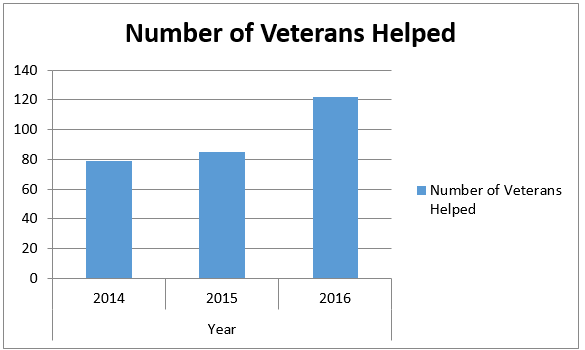
Step 1: Review raw data. We begin with our raw Excel data, which can easily export as a .CSV file. Many associations track their data this way. With Excel, the "insert chart" function is at my fingertips, and I can quickly create standard graphics, like column and bar graphs or line and pie charts. Google Charts can be another option.
Figure 1: Microsoft Excel
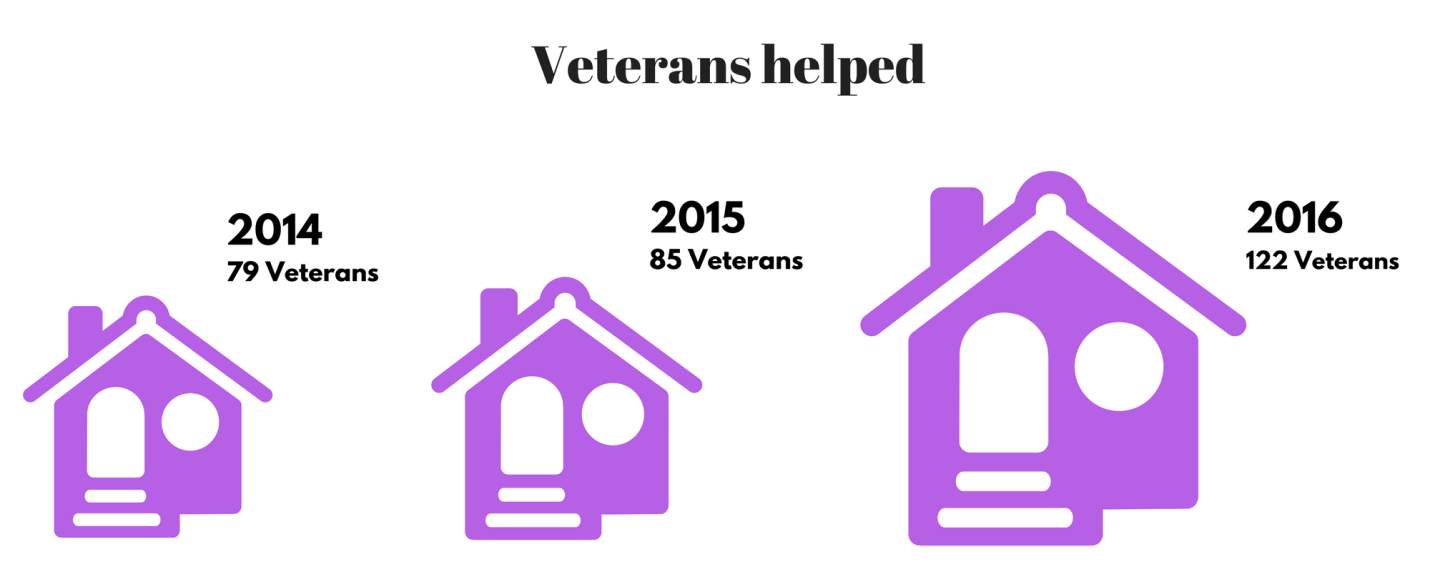
Step 2: Build a chart. Using Excel's chart function, I can create a basic, but boring, graphic. To make it more engaging, I want to replace the blue bars with something significant; in our case an icon of a house or bed would be ideal because we are sharing data about veteran housing numbers. Using symbols can enhance the broader message. My next stop is Canva, which is my favorite destination for free graphics and tools, though there are many others available. Canva offers more than 100 basic layouts and a variety of icons and fonts. After watching a 22-second demonstration of its drop-and-drag features, I can easily pull my infographic together. Some of the nicer icons cost $1 and the more advanced features, like resizing a graphic, require a subscription.
Figure 2: Canva
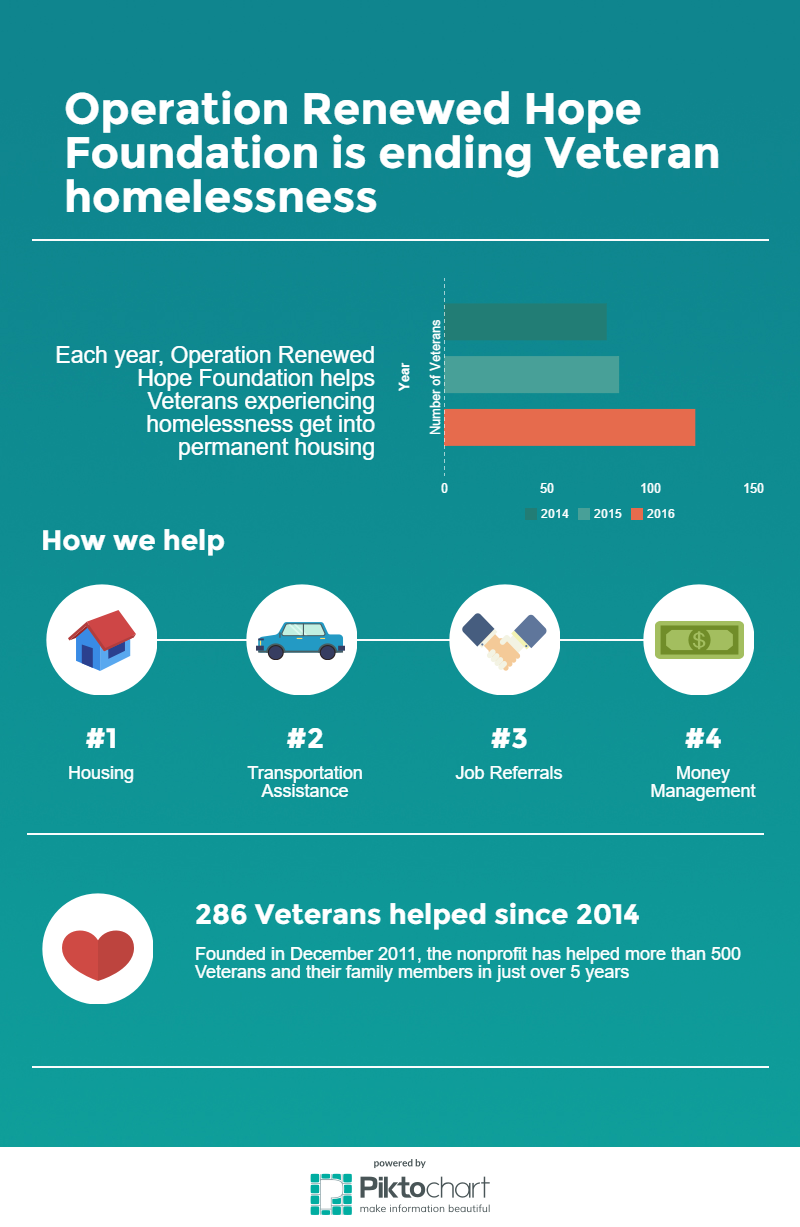
Step 3: Create more detailed infographics. After completing the first graphic, I start to think about showing more information, including how the nonprofit works. To do this, I turn to another free service, called Piktochart. This site generally takes an extra click—specifically you have to click to select the element, then click to edit it, and then click to alter your image—but it offers more granularity for users, like optional font sizes in every increment. The free version I used provides fewer templates, which is why I had to show the number of veterans helped on a bar graph in this final infographic. Be aware, though, that the free template exports with Picktochart's branding.
Figure 3: Piktochart.com
Some market research indicates infographics are shared more than other kinds of content, with one study saying they're three times more likely to be retweeted or reposted, because infographics are extremely portable.
If you want your infographic to be widely shared, you may want to avoid very dark or white backgrounds. Infographics that are widely circulated also do not require a lot of scrolling or close reading of small font and detailed points. Finally, if your intention is for the image to go viral, you'll want your brand clearly marked within the infographic.
Sophisticated infographics are best handled by professionals, but there are free tools available that allow the smallest of associations to build engaging, information graphics for internal and external use.