Debbie King
Debbie King is the CEO and founder of Association Analytics®, a company that provides data analytics services and solutions to associations.

If associations want to deliver professional development programs that are beneficial to learners and boost the organization's financial performance, they must employ both learning and business analytics.
There is no shortage of continuing-education options today. A growing list of free or low-cost online educational resources and training opportunities compete with associations for members' attention and investment.
With more options, learners expect consistent, seamless, and high-value experiences. If they don't get it from your association, they will go somewhere else. In response, associations are turning to data to not only help them understand and improve experiences but also improve their financial performance.
Data analytics is the process of transforming data into actionable insights and information. Associations frequently use data analytics to understand operational performance of educational programs.
Increasingly, organizations are turning to learning analytics to improve student experiences. According to the Society for Learning Analytics Research, learning analytics is the application of data analytics to answer questions about learners and their contexts. The goal is to understand and optimize learning and learning environments. In learning analytics, the focus is on the student experience and their outcomes of learning, and it can measure:
These metrics help associations improve programs and tailor future programs to a learner's individual needs. Learning analytics also help identify students who are either at risk of abandoning courses or underperforming.
Student experiences can affect the financial success of an association's programs. When students are satisfied and derive value from educational programs, it increases retention, turns students into advocates for the program, and ultimately boosts an association's bottom line. The latter is why organizations are using business analytics to measure the financial impact of students' experience. Metrics or key performance indicators that can determined using business analytics include:
The ultimate goal of measuring the financial performance of educational programs is for associations to find the best product and services mix that will drive revenue growth.
Whether associations choose to use learning analytics or business analytics, they should follow a five-step process.

Worldwide ERC, the Association for Workforce Mobility, provides an interesting example of how associations can employ learning and business analytics to improve professional development programs.
To improve exam success, Worldwide ERC explored the correlation between how far in advance students registered for a training course and the pass-fail rate on an exam. Association staff hypothesized that students who registered earlier were more likely to pass the exam. With that assumption in mind, Worldwide ERC collected and combined relevant data in a data warehouse and used Tableau to analyze it.
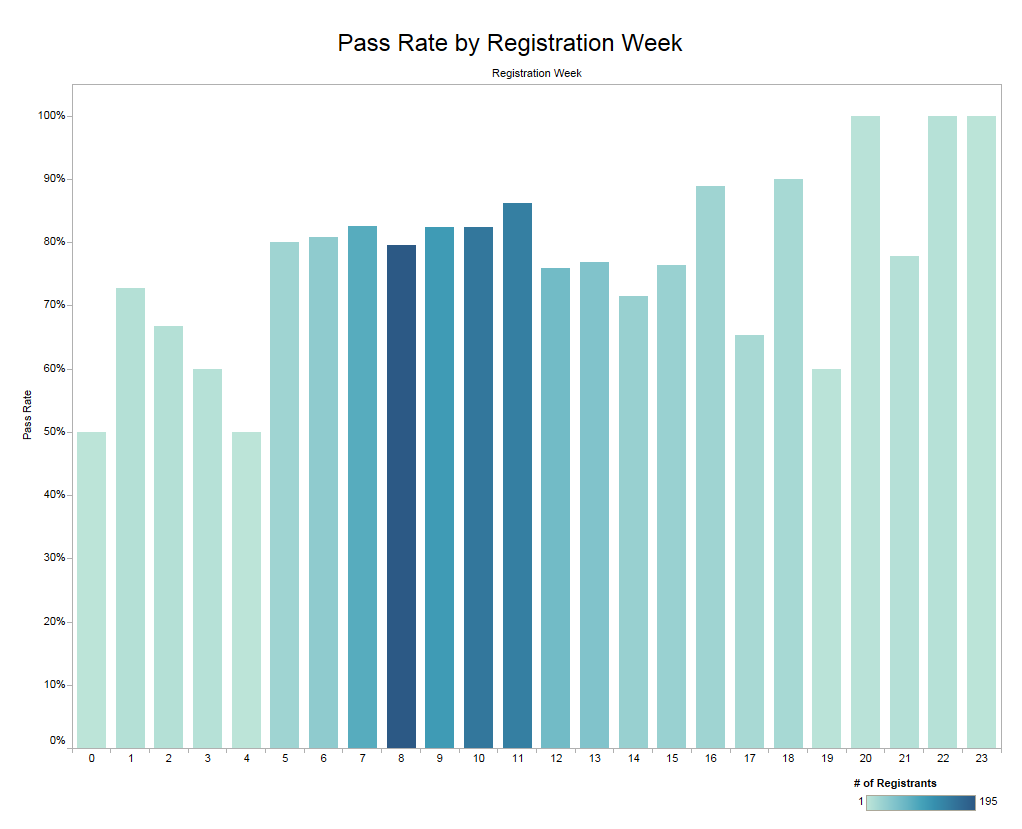
The graph (above) shows the number of registrants per week prior to the exam date and compares that to the exam's pass rate. The y-axis is the pass rate, while the x-axis represents weeks until the exam date. The color intensity indicates the number of registrants that week, with darker shades representing a higher number of registrants.
Interestingly, the analysis couldn't conclude that "early birds" are any more successful than someone who registers later. It is important to note that the highest number of registrants occurred 7 to 11 weeks out from the exam, and the higher volume affects the average pass rate.
This is an excellent example of the value of testing assumptions. Worldwide ERC discovered that those who register earlier don't necessarily pass more often.
Disproving assumptions is as important as proving them. In this case, the analysis prompted Worldwide ERC staff to ask new questions to better understand what leads to success for exam takers.
For example, staff asked if the date students begin studying has an impact on pass rate. Were students studying for the exam before they registered, or did they begin studying after registration? Alternatively, student experience or method of studying could impact pass rate.
This line of questioning and analysis can help Worldwide ERC develop a profile of the optimal student and identify what factors have greater impact on success than registration date. By identify characteristic of successful students, Worldwide ERC can also help the organization identify and provide assistance to less successful students.
Worldwide ERC's analysis is a good example of how data analytics can inspire both action and further exploration. It also illustrates the value of combining business analytics (e.g., registration date and registration counts) with learning analytics (e.g., pass rate). Associations must look at both to provide successful and sustainable professional development programs.