Davin Hattaway, CAE
Davin Hattaway, CAE, is an account manager for association consulting at M Powered Strategies in Washington, DC.

Do you wonder if your association's programs are priced correctly? A three-step price sensitivity analysis can help your organization to accurately determine value.
Many associations make pricing decisions based on pride, instinct, and inertia. You feel a program is worth $1,000, so that's what you charge, or you charge $1,000 because it was $950 last year and you needed to cover rising costs.
These considerations are important—there's no substitute for practical experience. But by using price sensitivity analysis, associations can add some analytical rigor to pricing decisions.
To understand price sensitivity, you first have to understand price elasticity. You probably learned about price elasticity in your high school economics class, but here's a quick refresher.
Some products are inelastic, meaning people will always pay because they need them. Water is an example of an inelastic product. You will buy water at any price, if you can afford it, because you need it to survive.
Other products are elastic, meaning people won't buy if the price is too high. Cigarettes are an example. Numerous economic studies have shown that price increases in cigarettes are by far the most effective way to reduce smoking. Smokers quit when the habit gets too expensive.
Association products and services are much more complex. They're somewhere between elastic and inelastic. Professionals may need to attend an event, training, or webinar to maintain critical certifications (inelastic), or they may want to attend them for professional growth if they can afford it (elastic). There are also dozens of other considerations, such as the organization's training budget.
The best method is to make small price changes to your products over time and measure the results.
So, how elastic or inelastic are your products? You can find out by conducting a price sensitivity analysis.
The most critical and difficult step is to collect data on how your members react to price changes. There are too many factors to make guesses based on your intuition.
The best method is to make small price changes to your products over time and measure the results. For example, reduce the cost of a product by $50, then increase it by $50, reduce it by $30, and finally increase it by $45. Measure how those price changes affect participation.
Many factors influence participation apart from price, such as economic conditions or the quality of speakers at an event. So, it's important to gather as many data points as possible. —Factors not related to price will average out in the analysis.
Price changes can be extremely political, and it may not be possible to play around with prices using the method above. If that's the case, gather as much data as you can from previous price changes. If you have colleagues at similar associations willing to share their data, that could be helpful as well.
The next step involves some work in Excel developing a scatterplot. To walk through an example, let's imagine that registration for your annual conference costs $700. You've experimented with price and now want to do a price sensitivity analysis. This example has more extreme price changes than most organizations would accept, but the exaggeration will help to illustrate the technique.
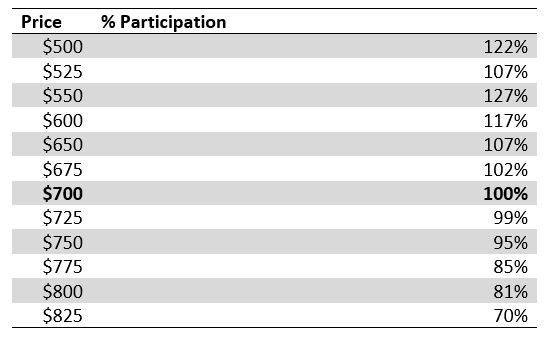
First, create an Excel table with your price changes and how they performed (in this case by participation rate). The results of each price experiment are compared against the average historical participation, which is marked as 100 percent. The experiments are shown as a fraction of that 100 percent baseline.
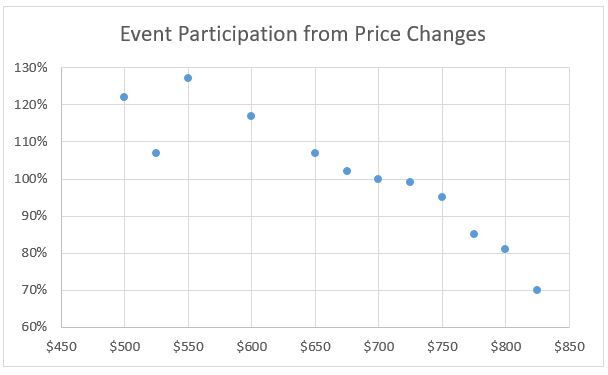
Next, create a scatterplot chart in Excel.
Finally, add a trendline. The type of trendline to use will depend on how much data you have collected. Try different trendline shapes to find the one that has the most honest expression of the data you collected. Excel offers several options for different trendline types, some of which are simple and some of which are very advanced. If you don't like statistics, don't have much data, or prefer something simple, you can select the "linear" or "polynomial" trendline, which is a curved line used for when data fluctuates. These are the easiest trendlines and often the best ones regardless of your Excel skills. You can also let Excel show the "R-squared" value as you compare options. Those values are numbered between zero and one and higher values are better.
Regardless of which trendline you pick, make sure to select one that looks right based on your practical experience with your association's activities. The trendline will be vital for step three, so it's important to get it right. This example uses a polynomial trendline:
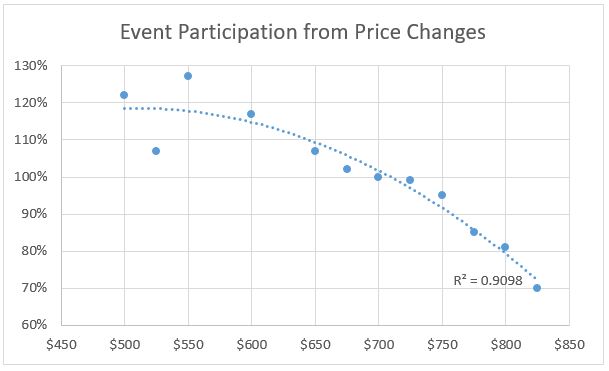
This trendline is your price sensitivity—a gauge of how elastic your product is. In this example, the product is fairly inelastic at prices below $650 and very elastic at prices above $750. A price reduction below $650 wouldn't increase participation, and a price increase above $750 would decrease participation.
The final step is to run simulations based on the trendline and find the best alignment of pricing to organizational goals.
Simulations don't have to be complicated. You probably have a spreadsheet that calculates your fixed costs and incremental costs and lets you project how much revenue a product, publication, or event might net.
Dig up that spreadsheet and add some numbers from the trendline. Now that you know your price sensitivity, you can match the two data points (price and participation) and adjust the numbers appropriately. In the example above, a price reduction to $650 would generate a 10 percent increase in participation, and a price increase to $800 would generate a 20 percent decrease in participation.
The net revenue will vary each time you input different pricing and participation numbers. Try a lot of these simulations, even the ones that you don't think will work, and you may be surprised by the results.
As you test, keep organizational goals in mind. Is this product meant to provide education to the largest possible audience? Or is it meant to generate as much revenue as possible?
While price decisions are complex and often fraught with internal politics, a price sensitivity analysis can add a degree of analytical rigor to these discussions. A detailed analysis requires a statistician, but anyone with basic Excel skills can gain insights from this simpler version of the technique.