Ahmed Farruk
Ahmed Farruk, CIMA, is a regional director and senior consultant at Fiducient Advisors in McLean, Virginia, and coauthor of the ASAE Research Foundation study, Association Investment Policies, Practices and Performance.
In January 2022, stock markets experienced a decline of almost 10 percent, after years of positive growth. Here, find out what’s behind the ups and downs of the stock market and what your association should be doing about it.
On June 16, 1884, the Switchback Railway debuted in New York City’s Coney Island as America’s first roller coaster. Quite possibly that afternoon, some 10 miles away on Wall Street, a quick-thinking broker coined the world’s first roller coaster/stock market analogy. And we’ve clung to it ever since. We’re all guilty of using it at some point or another (raises hand), but it remains one of the more relatable ways to describe the inevitable gyrations of the stock market.
Relatable, but imperfect.
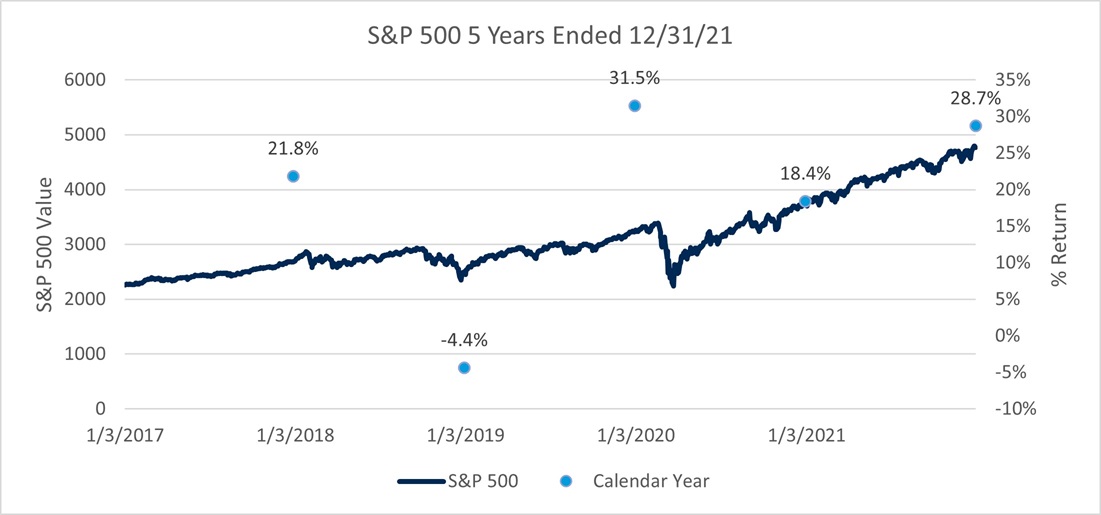
For starters, a roller coaster can only take an incline for so long; eventually, the laws of physics kick in and it loses momentum. Those thrilling declines are necessary to keep the ride going. But over the past five years, despite the steep drawdown experienced during the onset of global economic COVID-19 lockdowns, it has felt like this roller coaster has done nothing but go up. Particularly here in the US, where the S&P 500 has experienced double digit gains in four out of the past five calendar years, exceeding 20 percent in three of those years.
Source: WSJ.com, YCharts
Use of Indices and Benchmark Return Indices cannot be invested in directly. Index performance is reported gross of fees and expenses and assumes the reinvest dividends and capital gains. Past performance does not indicate future performance and there is a possibility of a loss. See disclosure page for indices representing each asset class.
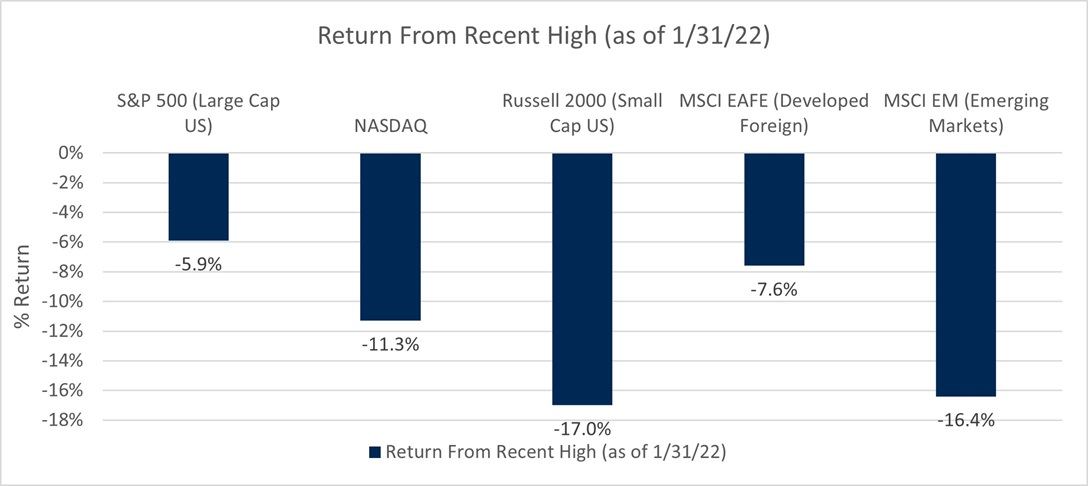
Second, dizzying drops also happen to be, for many, the most enjoyable part of a roller coaster ride. Not so much for stock market passengers. The stock market equivalent of a particularly scream-inducing descent is a correction—typically defined as a peak to trough decline of 10 percent. Many equity markets around the world came close to, or entered, correction territory in January.
Source: FactSet as of January 31, 2022
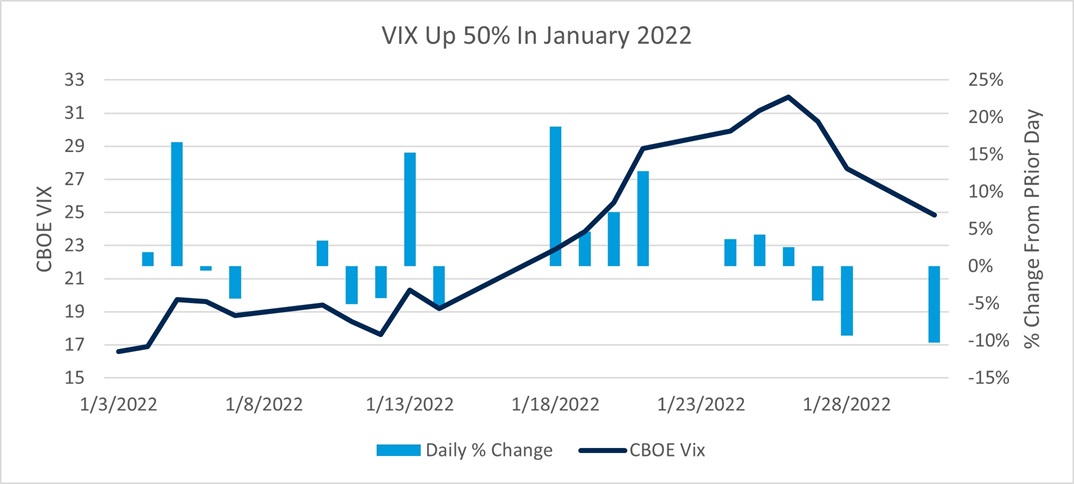
All the while, the markets got increasingly volatile. The Chicago Board Options Exchange VIX Index—sometimes referred to as the “fear index”—is an often-used measure of market volatility and sentiment. The higher the index, the more volatility in the markets. As noted below, this index climbed significantly from where it began the year and experienced double-digit percentage increases on numerous single days.
Source: CBOE as of January 31, 2022
Use of Indices and Benchmark Return Indices cannot be invested in directly. Index performance is reported gross of fees and expenses and assumes the reinvest dividends and capital gains. Past performance does not indicate future performance and there is a possibility of a loss. See disclosure page for indices representing each asset class.
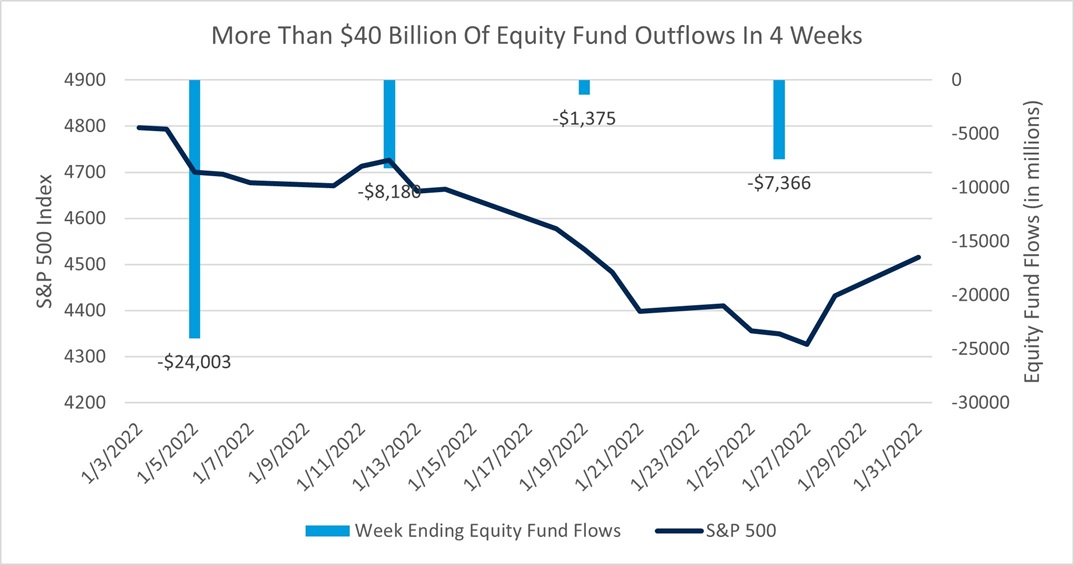
In response, rather than throw up their arms in delight and smile for the coaster camera, many investors jumped off the ride altogether. According to the Investment Company Institute, for the four weeks ended January 26, 2022, there were more than $40 billion in outflows from equity mutual funds.
Source: WSJ.com, Investment Company Institute (2/2/22)
While the formula for drawdowns in any asset category is typically a multivariate equation, three things helped to fuel the recent drawdowns in global equity markets:
Omicron wave. In addition to fueling record-setting case counts and spoiling many holiday plans, concerns about the surge of this latest variant drew into question the strength of our economic reopening and, consequently, the potential for corporate earnings growth to fuel market gains in 2022.
Surging inflation. We saw gains in prices not seen since the early 1980s. In a consumer-driven economy, a high rate of inflation can impact future economic growth.
Rising interest rates. The Federal Reserve has indicated that the party is ending. Reducing its supportive asset purchases and an ultimate increase in the federal funds rate will increase borrowing costs for all. While this is hardly an unexpected development given the low level of rates we were given in response to COVID, this confirmation nonetheless increases market uncertainty.
Consider taking these three steps:
Take a breath and put this year’s activity into proper context. Since 1980, the median intra year drawdown on the S&P 500 is 9.3 percent. Put another way, the decline that we saw in the S&P 500 peak to trough is roughly half of what we’ve seen in any given year for more than four decades.
Revisit your long-term portfolio’s asset allocation strategy. Portfolios should be grounded on long-range expectations, but there are opportunities to make adjustments along the way in light of renewed thinking on asset classes. Extreme conditions in the financial markets (both positive and negative) may increase that opportunity set. Fully understand the potential variability of your investment strategy and grip that lap bar accordingly.
Ensure that anticipated cashflow needs confirm that your assets that are subject to market risk are truly long term in nature. For long-term investors, it's been an extraordinary five years of growth. Now is as good a time as any to ensure that any cash flow needs, known or potential, are planned for accordingly.
There’s a reason why roller coasters have a cartoon cutout at the entrance that announces, “You must be this tall to ride this ride”. To safely ride the stock market, associations should fully appreciate not only the potential thrills, but also be secure enough in their seats to be able to manage the drops.
The content of this article has been obtained from a variety of sources that are believed, though not guaranteed, to be accurate. Opinions expressed do not necessarily represent the views of Fiducient Advisors. The content does not represent a specific investment recommendation. Please consult with your advisor, attorney, and accountant, as appropriate, regarding specific advice. Past Performance does not indicate future performance.
Comparisons to any indices referenced herein are for illustrative purposes only and are not meant to imply that actual returns or volatility will be similar to the indices. Indices cannot be invested in directly. Unmanaged index returns assume reinvestment of any and all distributions and do not reflect our fees or expenses. The S&P 500 is a capitalization-weighted index designed to measure performance of the broad domestic economy through changes in the aggregate market value of 500 stocks representing all major industries. The NASDAQ is a broad-based capitalization-weighted index of stocks in all three NASDAQ tiers: Global Select, Global Market and Capital Market. Russell 2000 consists of the 2,000 smallest U.S. companies in the Russell 3000 index. MSCI EAFE is an equity index which captures large and mid-cap representation across Developed Markets countries around the world, excluding the U.S. and Canada. The index covers approximately 85% of the free float-adjusted market capitalization in each country. MSCI Emerging Markets captures large and mid-cap representation across Emerging Markets countries. The index covers approximately 85% of the free-float adjusted market capitalization in each country. CBOE Volatility Index is a real-time index that represents the market’s expectations for the relative strength of near-term price changes of the S&P 500 index (SPX).